Load and plot length-tension data
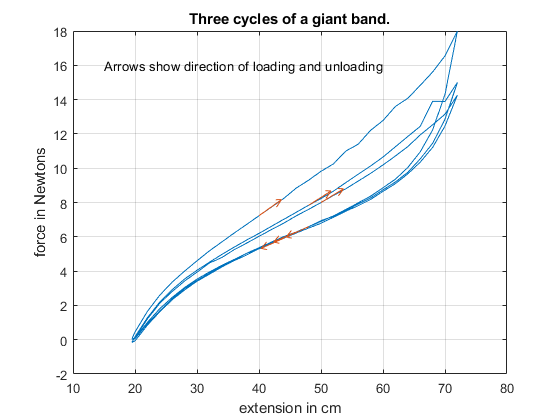
Three load and unload cycles were done on a 19.5cm restlength giantband. Graph shows that there is hysteresis. Note that the force data takes between 30 seconds and a minute to stabilise.
l0=19.5; % unstretched length of giantband. Appears to have a tollerance of 5mm
T = readtable('GiantbandLTdata.xlsx');
offset=l0-T.length(1);
leng=T.length+offset; % avoid using length as a variable as it is also a matlab function
plot(leng,T.force)
hold on
indx1=[12 40 70 95 125 150];
x=leng(indx1);
y=T.force(indx1);
u=diff([leng(indx1) leng(indx1+5)]');
v=diff([T.force(indx1) T.force(indx1+5)]');
quiver(x,y,u',v')
hold off
xlabel('extension in cm')
ylabel('force in Newtons')
title('Three cycles of a giant band.')
text(15,16,'Arrows show direction of loading and unloading');grid on
disp(sprintf('Publish source is %s.m on %s',mfilename,date));
Publish source is bandhysteresis.m on 07-Feb-2021